
Categories
Market UpdatePublished July 13, 2026
The Austin Real Estate Recovery Has Already Started (Here's the Data Everyone Else Is Missing)

The Austin Real Estate Recovery Has Already Started (Here's the Data Everyone Else Is Missing)
Home sales volume is the leading indicator. And in Austin, it's already turning.
Every headline about Austin real estate right now is built on the same data point: median home prices are 17.8% below the May 2022 peak, and industry projections have the market fully recovering to peak pricing sometime around September 2032.
That's true. It's also the wrong number to watch.
The number that actually tells you where the market is going is home sales volume, and that number turned in Austin four months ago. Almost no one is talking about it.
Why home sales volume is the recovery signal, not price
The relationship between volume and price in real estate is not a mystery, but it is consistently ignored by most market commentary.
Volume responds to buyer willingness first. When mortgage rates stabilize, when buyers stop expecting further declines, when relocation activity picks back up... transactions happen. Buyers show up. Homes close.
Prices, by contrast, respond to the tension between what buyers will pay and what sellers demand. Sellers are almost always the last to accept a new market reality. They anchor to what their neighbor got in 2022, not what the market will pay today. That means prices lag volume by 12 to 24 months in most real estate cycles.
When you see units sold accelerating year-over-year while prices are still flat or slightly down... you are looking at the earliest possible recovery signal.
What Austin sales volume is actually doing in 2026
Here is the actual data from the Austin MLS through Q2 2026:
Q1 2026: 7,473 units (Q1 2025: 7,307) ... +2.27% YoY
Q2 2026: 10,503 units (Q2 2025: 9,786) ... +7.32% YoY
H1 total: 17,976 units (H1 2025: 17,093) ... +5.16% YoY
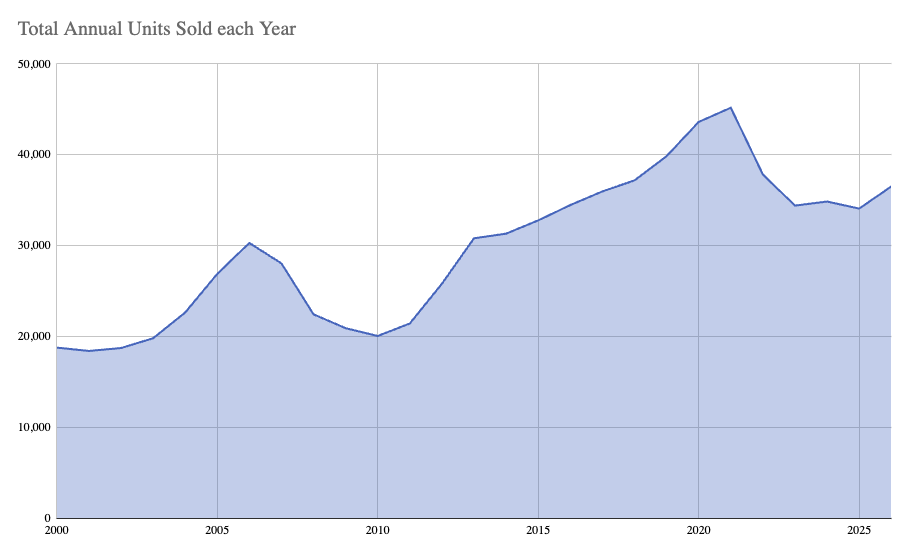
Full-year projection: 36,506 units (2025 actual: 34,079) ... +7.12% projected
The Q2 number is the one that matters. A 7.32% year-over-year jump in transaction volume is not noise. It is not one anomalous month. It is an entire quarter where buyer activity meaningfully accelerated over the same quarter in the prior year.
This is happening while median sold price is still 17.8% below the 2022 peak. Both facts are true at the same time. And volume moving first is exactly what the historical pattern predicts.
The historical parallel: 2007 to 2013 in Austin
The last time Austin went through a major real estate correction, the shape of the recovery was nearly identical to what is happening now.
2007 peak: 28,050 units sold
2010 bottom: 20,059 units sold (down 28.5% from peak)
2011 recovery begins: +6.8% year-over-year
2012 breakout: +20.4% year-over-year
2013 confirmation: +19.4% year-over-year, surpassing 2007 peak
Prices in Austin did not broadly recover to 2007 levels until 2014-2015. Volume led price by roughly two years.
Now compare that to the current cycle:
2021 peak: 45,175 units sold
2023 bottom: 34,406 units sold (down 23.8% from peak)
2024: +1.3% (soft first year of recovery)
2025: -2.2% (retested the bottom)
2026 annualized: +7.12% projected
The shape is not quite identical (2025 was a softer year than 2011 in the last cycle), but the fundamental pattern is the same. Sharp correction, one or two soft years testing the bottom, then a real volume rebound before prices catch up.
If the pattern holds, Austin home prices should begin recovering meaningfully in 2027-2028, not 2032. The volume data is telling us the linear projection is wrong.
Austin has historically led the national market
Austin has a well-earned reputation as a leading indicator for the broader U.S. housing market. It fell earlier than most metros in 2007-2010, and it recovered earlier and faster once the cycle turned.
The reason is not magic. Austin has three characteristics that make it a high-beta market compared to the national average:
1. Concentrated tech employment means the local economy responds to broader economic shifts before regional markets do
2. A high share of relocation buyers means demand is elastic to national conditions, not just local fundamentals
3. Newer housing stock and higher turnover means less generational holder friction, so prices move faster in both directions
Now watch what is happening in 2026: while Austin volume is up 5.16% year-over-year in H1, national existing home sales are running essentially flat, around 4.02 million annualized as of April 2026, with year-over-year growth in the low single digits.
Austin is running ahead of the national market again. Same pattern, different cycle.
What this actually means for buyers and sellers right now
For sellers who have been sitting on the fence:
If you have been waiting for the market to fully recover before listing, the volume data is telling you something important. The window when buyer demand is building, but seller supply has not yet caught up, is the strongest negotiating position a seller can have. It typically lasts 12 to 24 months, and it starts before prices fully recover. That window is opening in Austin right now. Waiting for prices to hit 2022 peaks before listing means selling into a market where every other pent-up seller is also listing at the same time. That is not the pricing power position most people think it is.
For buyers who have been waiting for prices to bottom:
Volume rising ahead of price is the tell that the bottom is behind us, not ahead of us. That does not mean prices spike tomorrow. But it does mean the leverage buyers have had for the last 18 months is starting to compress. The window of highest buyer negotiating power is right now, not next spring.
For everyone in a specific Austin neighborhood:
The metro-wide numbers hide huge neighborhood-level variation. Some communities like Barton Creek West are only 9.9% below their 2022 peak. Others are 27% below. Your recovery timeline depends on your specific neighborhood, your specific price point, and your specific hold horizon... not the metro average.
Frequently Asked Questions
Is Austin real estate recovering in 2026?
Yes. Home sales volume in Austin is up 5.16% year-over-year in the first half of 2026, with Q2 2026 up 7.32% versus Q2 2025. This is happening while median prices remain 17.8% below the May 2022 peak, which is the textbook pattern of a recovery where volume leads price.
When will Austin home prices recover to the 2022 peak?
The most widely cited projection has Austin returning to peak median prices around September 2032. However, based on the volume-leads-price pattern, meaningful price recovery in Austin should begin in 2027-2028, with a full return to 2022 peak levels somewhere between 2029 and 2031 in most neighborhoods.
Does Austin lead the national real estate market?
Historically, yes. Austin bottomed in 2010, one year ahead of the national existing home sales bottom in 2011. Austin also recovered faster in 2012-2013. As of mid-2026, Austin volume is up 5.16% year-over-year while national existing home sales are running approximately flat.
Should I sell my Austin home now or wait?
The volume data suggests the strongest seller negotiating window is opening right now, before prices fully recover. Waiting for peak prices typically means selling into a market where pent-up seller supply has also returned, compressing pricing power.
Is now a good time to buy in Austin?
For buyers with a 5+ year hold horizon, the current window may offer the best combination of pricing leverage and long-term appreciation setup that Austin has offered since 2019. Volume recovery signals suggest buyer leverage is peaking now and will begin compressing in the next 12 to 24 months.
About the author
Clay Byrne is the founder and principal broker of Byrne Real Estate Group and the founder of Buyer's Rate Mortgage, serving buyers and sellers across Central Texas. With 20+ years in Austin real estate and over $500 million in career transaction volume, Clay maintains an original weekly Austin economic dashboard tracking MLS unit sales, active inventory, mortgage rates, and market velocity.
Contact: clay@byrne-austin.com
Want a data-driven read on your specific neighborhood?
The metro-wide recovery story is real, but your specific timeline depends on where you live. If you want a personalized market analysis for your neighborhood or a home you are considering, reach out. No pitch, no pressure... just the numbers.
Sources: Austin MLS data via ACTRIS. National existing home sales data via the National Association of REALTORS. Historical annual sales analysis compiled from BREG's internal Austin Economic and Statistics Dashboard, tracking Austin market data since 2000. Full-year 2026 projections calculated by extrapolating H1 2026 actual units against the historical H1 share of full-year sales (approximately 49.2%).

Clay Byrne
| Byrne Real Estate Group | Keller Williams Realty
or another way